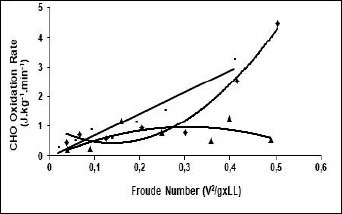
Figure 2.
Raw data graph displaying three examples of different responses taken during normal walking of CHO oxidation rate (J·kg
-1
·m
-1
) in relation to Fr.