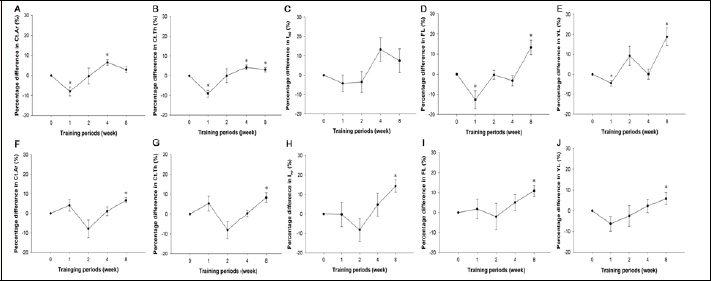
Figure 2. Percentage differences in various geometric and biomechanical properties. Percentage differences between landing groups and their age-matched control groups were calculated for indices of geometry and biomechanical properties in femora (A-E) and tibiae (F-J). Values are means ± SEM. *, significantly different from 0 week. Ct.Ar, cortical bone area; Ct.Th, cortical bone thickness; Iml, moment of inertia about the mediolateral axis for femora; Iap, moment of inertia about the antero-posterior axis for tibiae; FL, fracture load; YL, yield load.