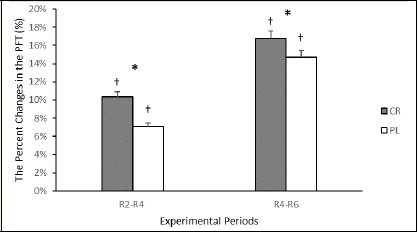
Figure 2. The percentage (5) change of the plantar flexion peak torque at the recovery (R2-R4) and during the maintenance phases (R4-R6) in the CR and PL groups. * Indicates significant differences between the CR and PL groups (p<0.05). † Indicates significant relative change in the experimental groups (p<0.05). Values are means ± SD.