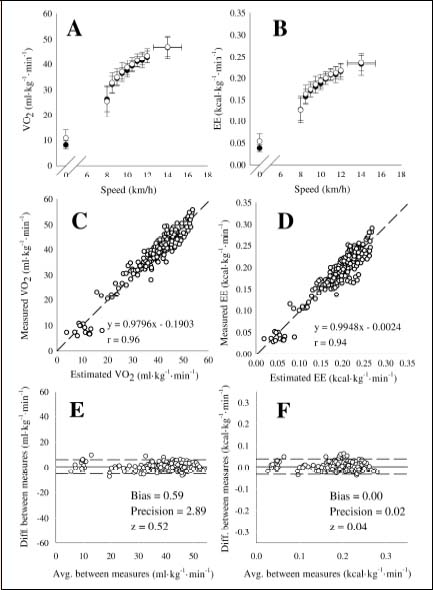
Figure 2. Panel A and B: mean directly measured and estimated VO2 (A) and EE (B) are displayed as functions speed. Panel C and D: individual estimated VO2 (C) and EE (D) values are plotted as functions of directly measured values. Panel E and F: Individual differences between the measured and estimated VO2 (E) and EE (F) values are plotted as functions of the mean of the two measures. Bias (i.e., mean difference between measures; solid line) and precision (i.e., limits of agreement; dashed line) are displayed along with numerical values and the results of the one-tail z test on the bias.