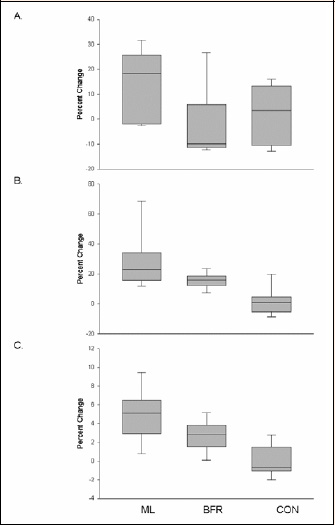
Figure 2. Box plots of percent change following moderate-load (ML), low-load blood flow restricted (BFR) and control (CON) group interventions in a) isometric torque, b) leg extension one-repetition maximum (LE 1-RM) and c) knee extensor muscle volume. The top and bottom lines and the line through the middle of the box represent the 75th percentile (top quartile), 25th percentile (bottom quartile), and 50th percentile (median), respectively. The whiskers on the bottom extend from the 10th percentile (bottom decile) and top 90th percentile (top decile). There are significant time x group interactions for LE 1-RM (p = 0.02) and knee extensor volume (p = 0.02).