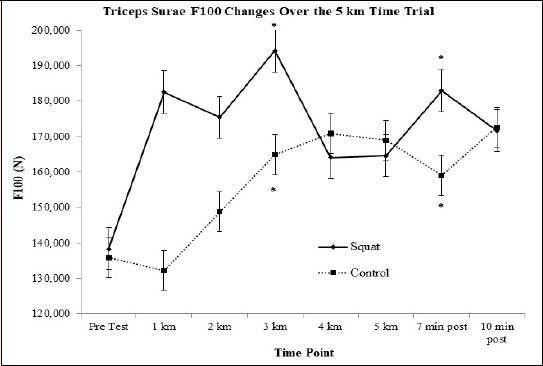
Figure 2.
Representative graph of force developed in the first 100 milliseconds (F100) at each time point. Evident interaction of changes over time. * indicates the condition value was significantly greater than pre-test.