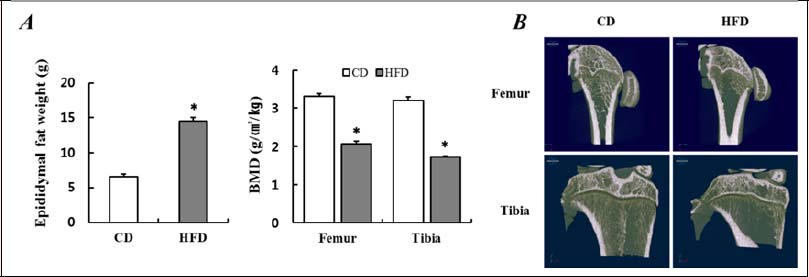
Figure 2. Increased epididymal fat mass and decreased BMD according to 8 weeks high-fat diet. (A) Comparison of epididymal fat mass and BMD after 8 weeks high-fat diet. (B) Representative micro-computed tomography image in femur and tibia bone after 8 weeks of high-fat diet. Data are presented as mean ± SE. * p < 0.05 vs. CD by t-test. CD, control diet; HFD, high-fat diet; BMD, bone mineral density.