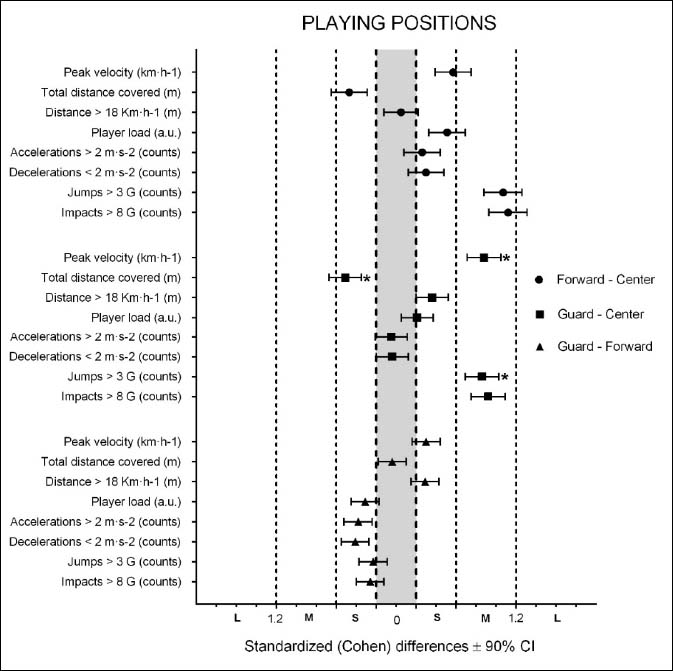
Figure 2. Standardized differences (Cohen’s d) and the 90% CI between playing positions for the eight load variables selected. L = Large effect; M = Moderate effect; S = Small effect. Significant difference is reported with * at the right end of the CI bar.