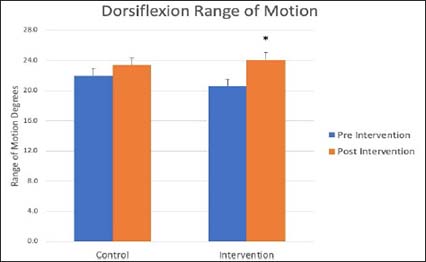
Figure 2.
Dorsiflexion range of motion measurements for each group at both the baseline run as well as at the post intervention run. * indicates a significant increase in dorsiflexion in the intervention group (p = 0.009).