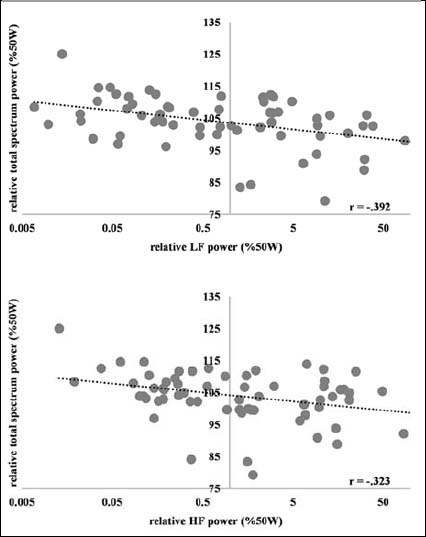
Figure 2.
Correlations of total spectrum power and HRV parameters during GXT. GXT data normalized to 50W-values and presented as %50W, data of 50W excluded. LF and HF power plots with log-10 scale, r Spearman’s rank correlation coefficient.