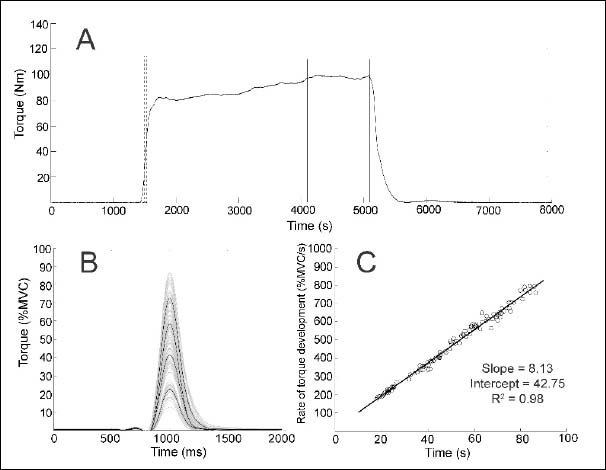
Figure 2. (A) An example of the torque signal during maximal voluntary contraction task, with the dashed line representing the time points at 50 and 100 ms after the onset of the torque rise. Maximal torque value during the 1-s interval (solid lines) was taken for further analyses. All rapid isometric pulses (B) for one dominant limb of one participant are shown, time-aligned to the onset of torque. The rate of torque development scaling factor calculation (C) results are also shown for the same participant.