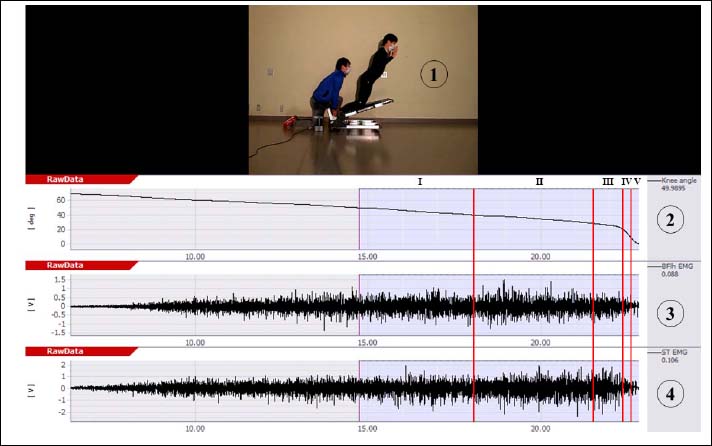
Figure 2. Electromyography and kinematics data during the N20. 1: Knee flexion 50° posture of N20; 2: Knee flexion angle (I: 40-50°; II: 30-40°; III: 20-30°; IV: 10-20°; V: 0-10°); 3: BFlh EMG raw data; 4: ST EMG raw data. The light blue area indicates knee flexion of 0-50°.