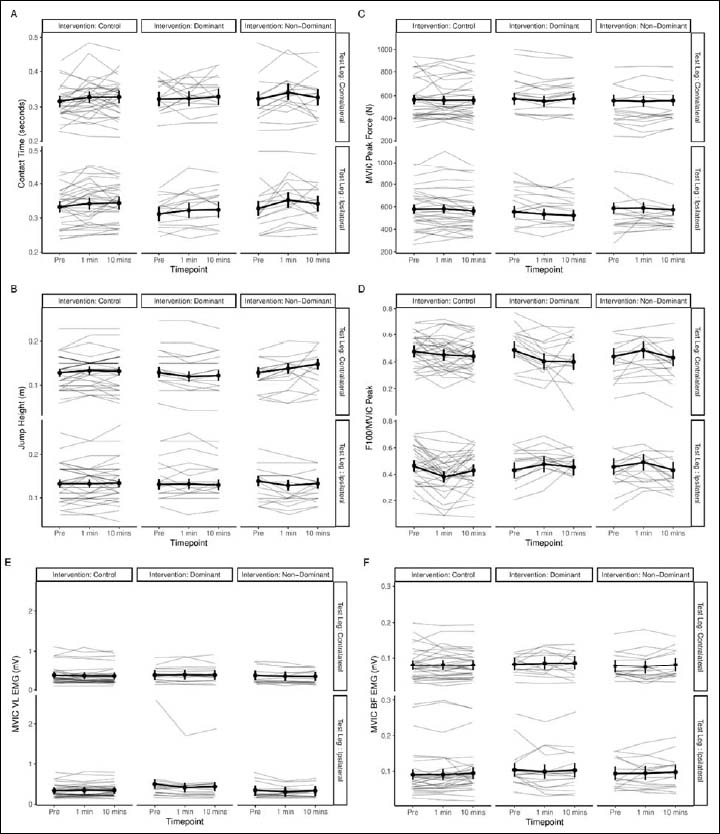
Figure 2. Means, standard deviations (bolded) and individual participant data (shaded) plots for all measures. X axis: Testing occurred at pre-test, and 1-min and 10-min post-test. CON: Control, D: Dominant leg, ND: Non-dominant leg Column titles: CONTRA: testing of the contralateral leg, IPSIL: testing of the conditioned exercised leg.