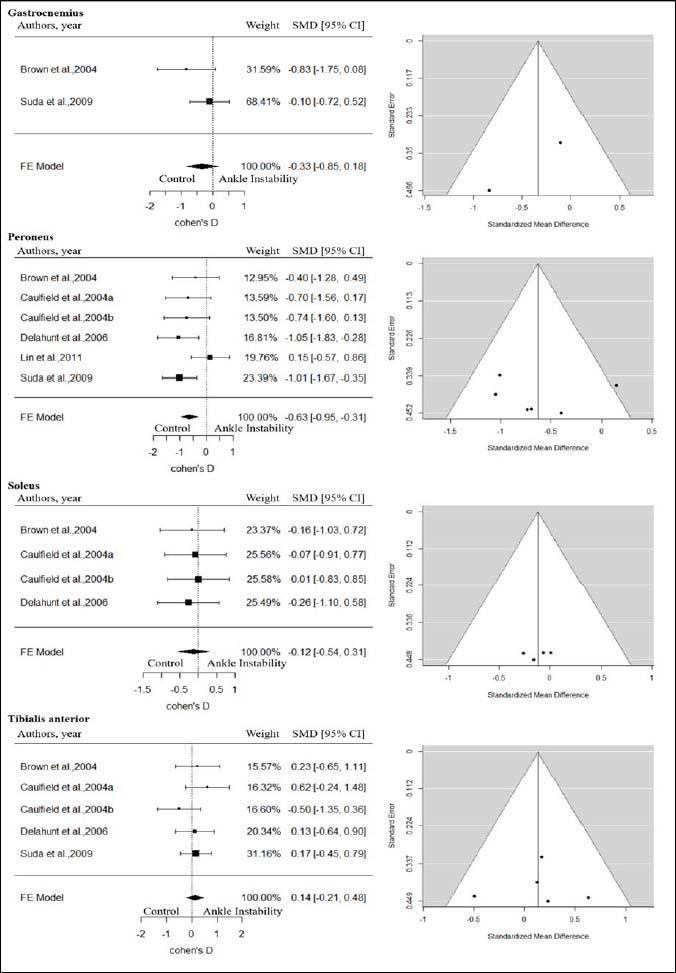
Figure 2. Forest plots of the meta-analysis for SMD in area of muscle activation of the lower leg before landing (left side) and funnel plots of standard error by each muscle for the studies included in the meta-analysis (right side). For Caulfield et al. 2004a and 2004b refer to two different landing conditions by the same study: a was identified muscle activity from initial contact to 150 ms during sing leg jump landing from 40 cm height; b was identified muscle activity from initial contact to 150 ms during sing leg jump landing from 100 cm distance. Abbreviations: CI, confidence interval; FE, fixed-effects; SMD, standardized mean difference