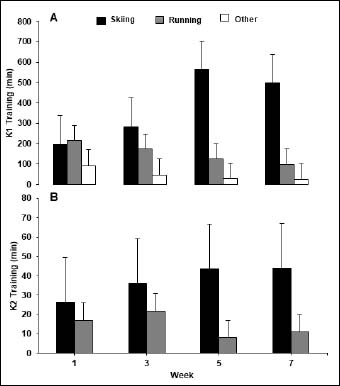
Figure 2.
Graphs A and B represent the weekly distribution of exercise training modes for easy (K1) and hard (K2) training during all weeks of testing.