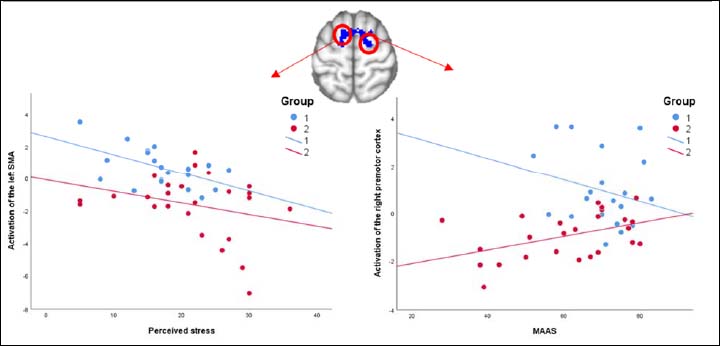
Figure 2. Plots showing the significant correlation of the functional activity of the left SMA and the premotor cortex with the perceived stress and the MAAS total score, respectively. The right hemisphere corresponds to the right side of axial and coronal views. The blue spots represents the outdoor group, while the red spots represents the indoor group.