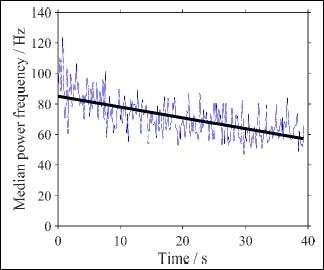
Figure 2. Sample data (M.biceps femoris of the tested leg in the standardized test version) of the power spectral analysis using the surface electromyography signal. Blue line = median power frequency (MPF), calculated using short-time Fourier transformation (500ms gliding Hanning window). Black line = Linear regression MPF/time slope.