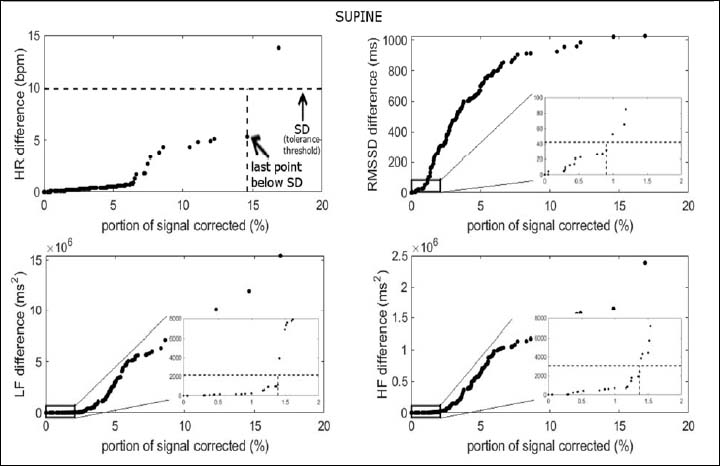
Figure 2. Supine position; x-axis: portion of the signal that contained artifacts before correction; y-axis: HR, RMSSD, LF or HF differences between raw trace and corrected trace. Horizontal dashed line is the standard deviation of the population, vertical dashed line crosses the last data point that is below the horizontal line, which is the least acceptable limit before artifacts changed the results more than the standard deviation of the population.