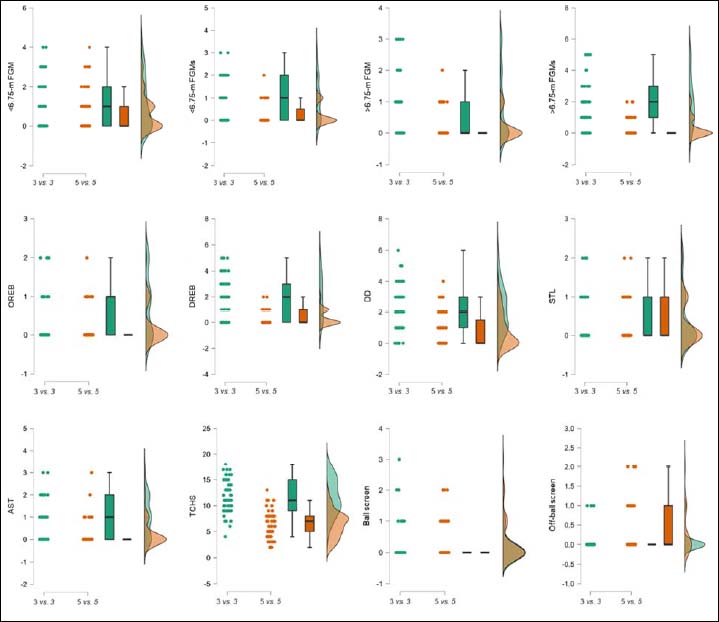
Figure 2. Raincloud plots showing the distribution of the technical-tactical variables according to the game conditions. The clouds of points indicate all data points, the boxplots indicate the data distribution, the median and the 1st quartile (25th percentile) and the 3rd quartile (75th percentile), and the one-sided violin plots indicate the data distribution for each game condition.