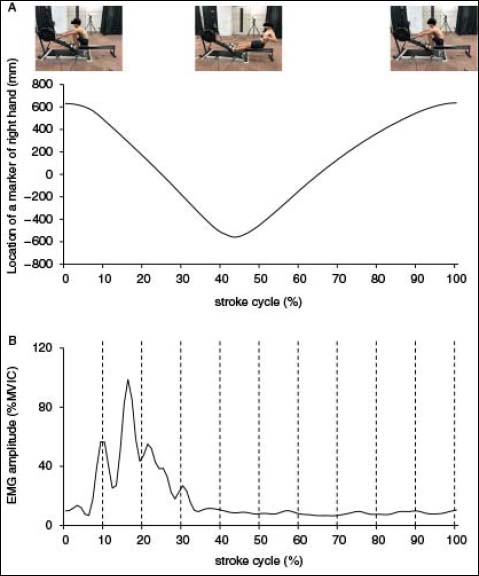
Figure 2. (A) Trajectory data measured using the motion analysis system with an infrared reflective marker attached to the right wrist. Positive values indicate that the infrared reflective marker is positioned infront of its resting position, while negative values indicate that it is positioned behind its resting position. Each stroke cycle was defined by the sagittal position of the infrared reflective marker and consisted of one stroke from the “catch position,” where the infrared reflective marker was positioned furthest forward, through the “finish position,” where it was positioned backward, to the next catch position. (B) The EMG amplitude is normalized by the maximum voluntary isometric contraction value. The mean value is calculated at every 10% of the stroke cycle in accordance with the stroke cycle specified in the trajectory data and used for statistical analysis.