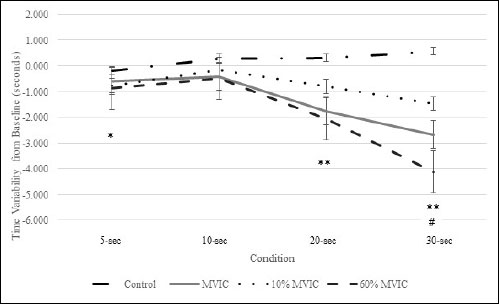
* p < 0.05: 100% MVIC, 60% MVIC and 10% MVIC significantly different compared to control
** p < 0.001: 100% MVIC and 60% MVIC significantly different compared to control
# p=0.01: 60% MVIC significantly different than 10% MVIC