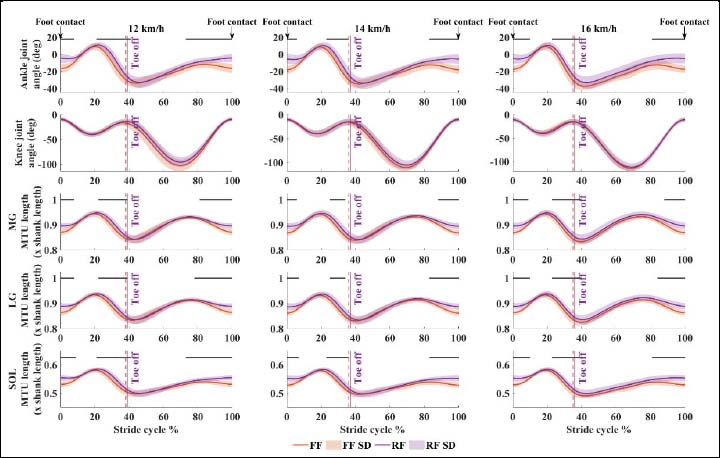
Figure 2. Ankle and knee joints displacement and plantarflexor MTU length changes. Group means and SD of the ankle and knee joint displacements and MTU length changes of medial (MG) and lateral gastrocnemius (LG) and soleus (SOL) during forefoot (FFS) and rearfoot running (RFS) at three different running speeds. Vertical dashed lines define the subphases of the running stride (0-100%) as stance phase (from initial foot contact at 0% to maximum knee angle in stance at toe-off) and swing phase (from toe-off to initial foot contact at 100%). The solid purple vertical line shows the end of stance phase during FFS running and the orange dashed line during RFS running. The black solid lines show the results of the SPM paired t-test between FFS and RFS. When the calculated SPM{t}value crossed the critical threshold at any point or region, the difference was statistically significant and marked with a black line.