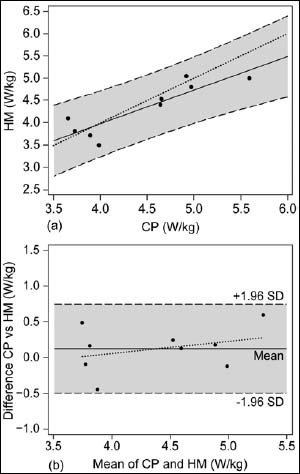
Figure 2. Agreement between the power output of the 9/3-minute Stryd CP and the half-marathon: (a) Linear regression analysis. Solid central line represents the fitted equation; upper and lower dashed lines show 95% confidence intervals; dotted line represents line of equality y = x ; (b) Bland Altman plot. Solid central line represents the mean between methods (systematic bias); upper and lower dashed lines show systematic mean ± 1.96 SD (random error); dotted line depicts linear regression (proportional bias).