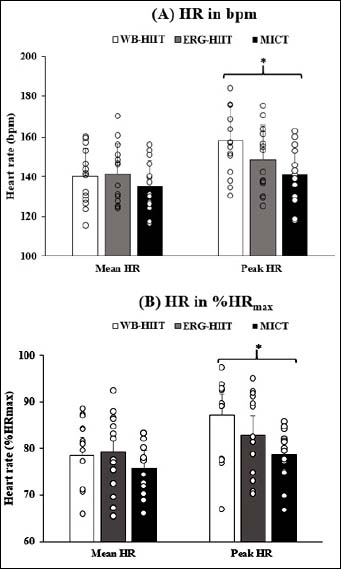
Figure 2.
Differences in mean and peak HR responses to WB-HIIT, ERG-HIIT, and MICT (mean ± SD) (a) in bpm (b) in %HR
max
. *p < 0.05 between WB-HIIT and MICT.