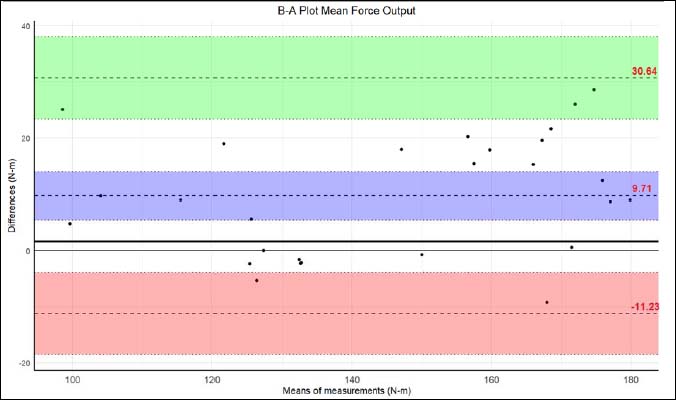
Figure 2.
Bland and Altman diagram for mean peak force (values indicate the bias, upper limit of agreement, and lower limit of agreement)