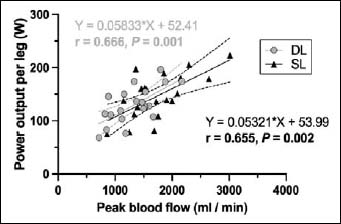
Figure 2. Pearson’s correlation coefficients between peak femoral blood flow and power output during double- and single-leg cycling. Pearson’s correlation coefficients are presented for all participants (i.e., O60 and U40) considered as a single group. Double- (circles, grey) and single-leg (triangles, black) cycling is presented separately. The equations for each linear regression line are presented separately during double- (grey) and single-leg (black) cycling. Continuous lines represent mean slopes. Dashed lines represent 95% confidence intervals.