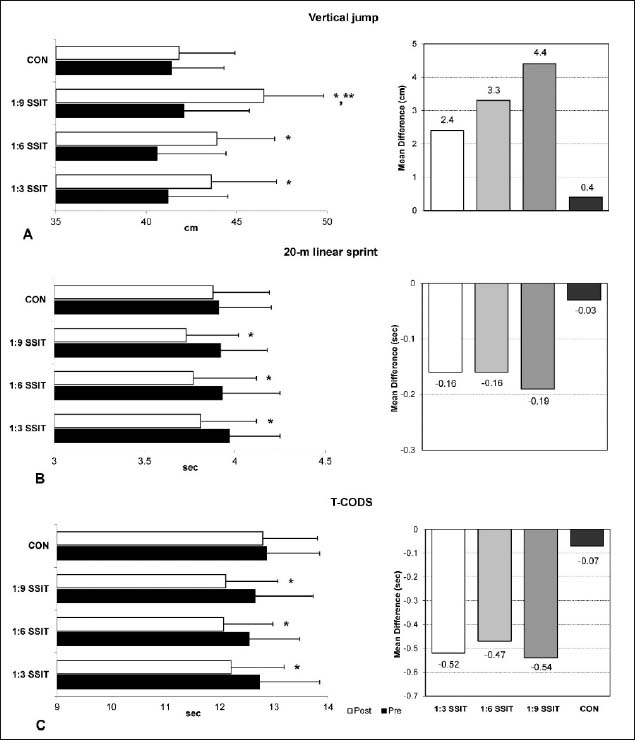
Figure 2.
Changes in vertical jump, 20-m linear sprint and T-CODS following the 7-week SSIT (Mean ± SD). * indicates significant differences versus pre-value and CON (p < 0.05). **indicates significant differences compared with 1:3 SSIT (p < 0.05).