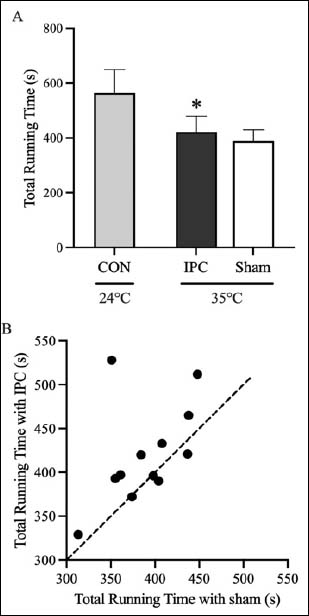
Figure 2. Endurance running performance. (A) Total running time during EX2 and (B) a scatter plot of running times in IPC and sham conditions are shown. Individuals who performed better with IPC administration (vs. sham) fall above the dashed line and those who performed worse fall below the line. Data are presented as mean ± SD; n = 12. *P < 0.05 vs. sham.
