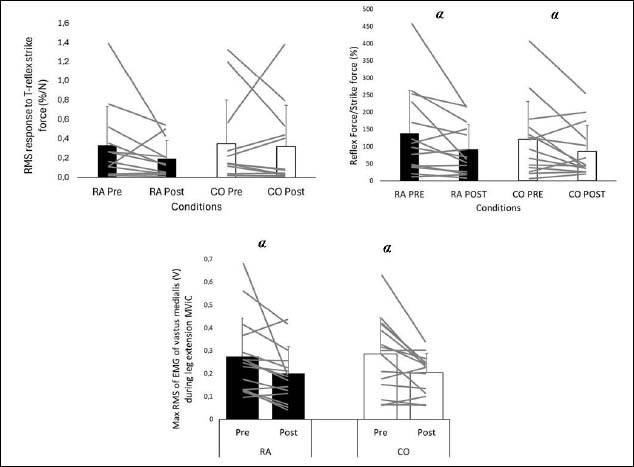
Figure 2. T reflex and EMG results. RMS response to T-reflex (top left). Knee extension force in reaction to T-reflex (top right). EMG during leg extension MViC (bottom). RA: Random condition. CO: Constant condition. Pre: Pre-test. Post: Post-test. RMS: Root Mean Squared. EMG: Electromyography. Lines on the graphs represent individual data. α: main effect of time (p<0.05). Error bars represent standard deviations.
