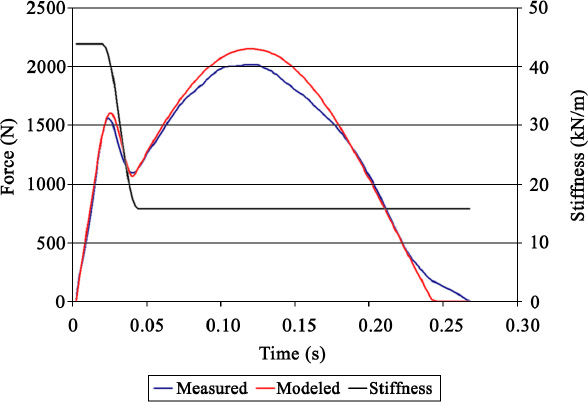
Figure 3.
Comparison of measured and modeled vertical ground reaction forces using a varying stiffness. The varying stiffness, shown with the dark curve, begins high finishing low with a smooth curve connecting the two with half a cosine wave.