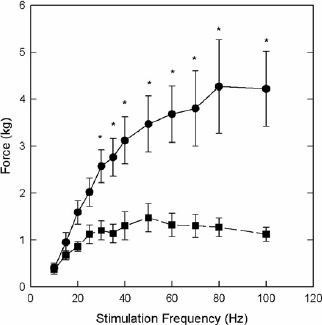
Figure 3.
Fatigue protocol results of TA in SCI () and control subjects (). All forces for SCI were significantly lower than those of the control subjects (p < 0.05). (Error bars represent SE).