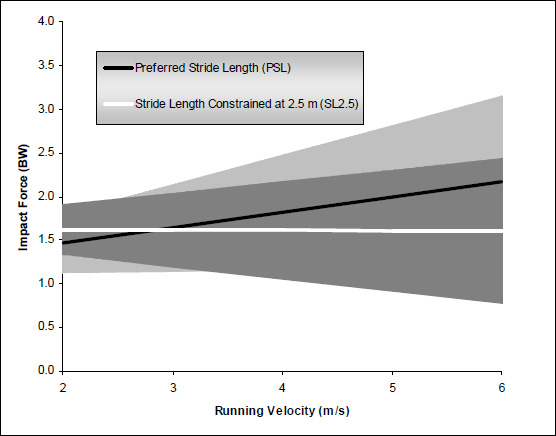
Figure 3. Illustration of the impact force and running velocity relationship during each running condition. The solid lines represent the group mean slope for impact force-velocity relationship while the shaded regions represent the between subject variability (i.e., slope standard deviation). The slopes were different between stride length conditions (p < 0.05).