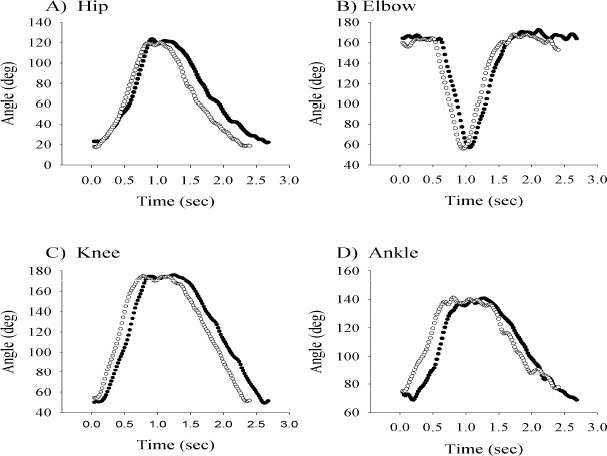
Figure 3. Examples of range of motion graphs obtained from 2-D (Peak-Motus) video motion analysis of one rower for Concept 2C (solid circles) and Rowperfect (hollow circles) during a representative rowing cycle. The graphs are for A) Hip, B) Elbow, C) Knee, and D) Ankle joints , respectively, with each point obtained from a frame by frame analysis (sample rate of 50 Hz) of the sequence.