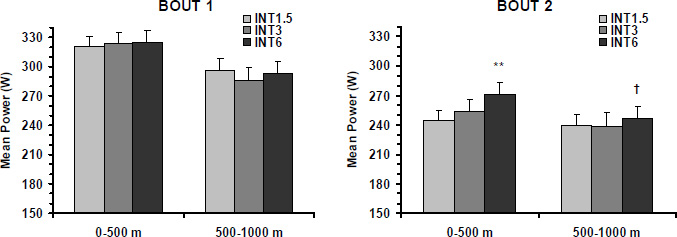
Figure 3. Mean power output during the first and the second 500 m of bout 1 and bout 2 during the three interval conditions. ** denotes p < 0.01 compared with INT1.5 and INT3 and † denotes p < 0.01 compared with 0-500 m of the corresponding interval in bout 2 (INT6).