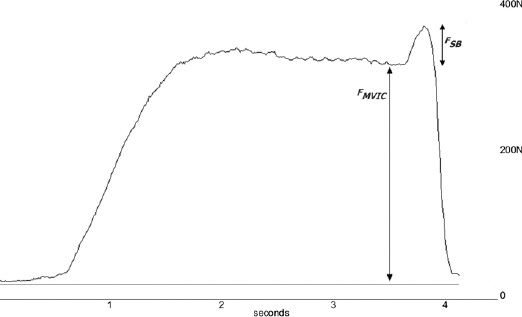
Figure 3.
Sample tracing of force and EMG measured during the SIB technique with labels showing MVC and ST force components of the curve.