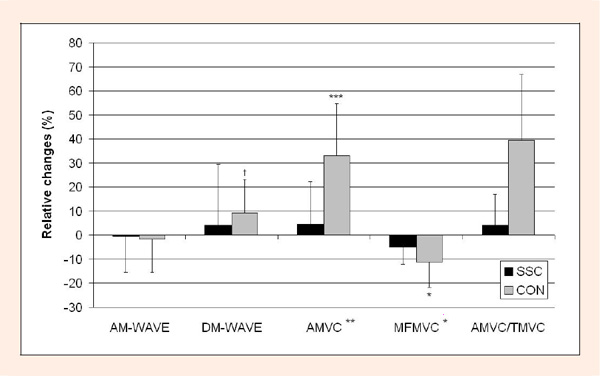
Figure 3. A-peak to peak amplitude of the M-wave; D- peak to peak duration of the M-wave; A-average amplitude of rectified SEMG signal during MVC; MF- median frequency of SEMG power spectrum; A/T - average amplitude of rectified SEMG signal during MVC divided by maximal torque; SSC-stretch-shortening cycle exercise; CON-concentric exercise; asterisks denote significant differences compared to the value before each exercise († p < 0.06; * p < 0.05; ** p < 0.01; *** p < 0.001); asterisks on the x-axis denote the significance of time and exercise main effects; all the data are given as means with their standard deviations.