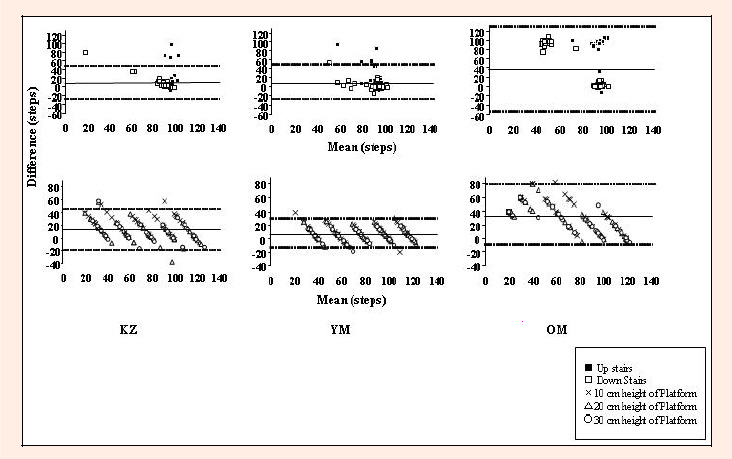
Figure 3. KZ; Lifecorder: YM; DW-800: OM; HJ-700IT. At the upper side, the three illustrations show pedometer accuracy during stair climbing and the three illustrations on the at lower side show pedometer accuracy during bench stepping. The X-axis is the mean of the actual- and pedometer determined steps. The Y-axis shows the difference of the actual and pedometer determined steps (actual step minus pedometer-determined step). The horizontal solid lines show the mean error score, and the horizontal dashed lines show the 95% confidence intervals of the individual observation.