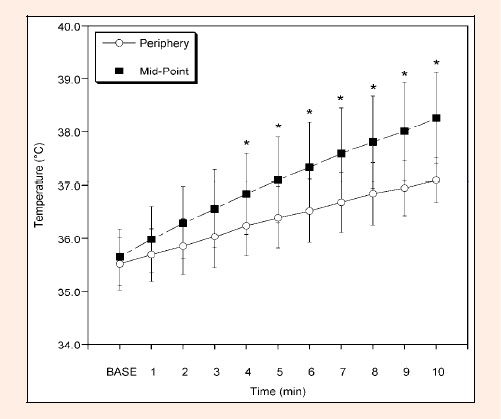
Figure 3.
* denotes significant difference between midpoint and periphery at the respective time point, p < 0.0045.