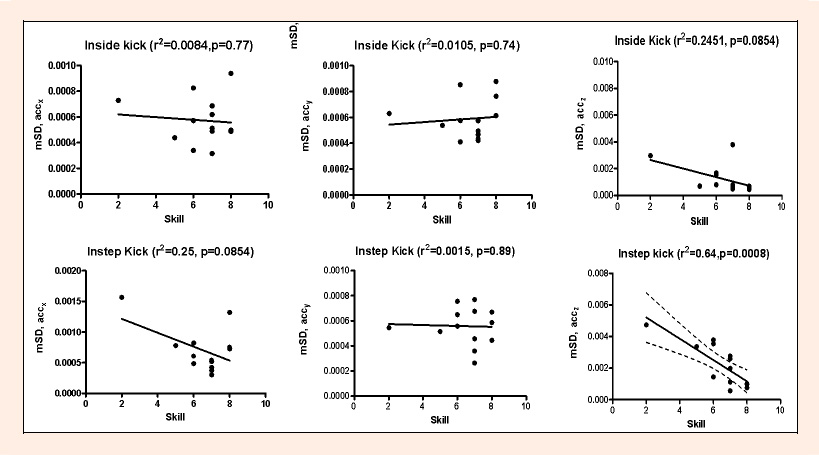
Figure 3. Repeatability indices (mSD) of acceleration (x, y and z) vs. skill graphs for different shooting techniques. Square of pearson- r values and corresponding p-values are shown on the graphs. 95% confidence intervals are drawn if p-value is less than 0.05.
