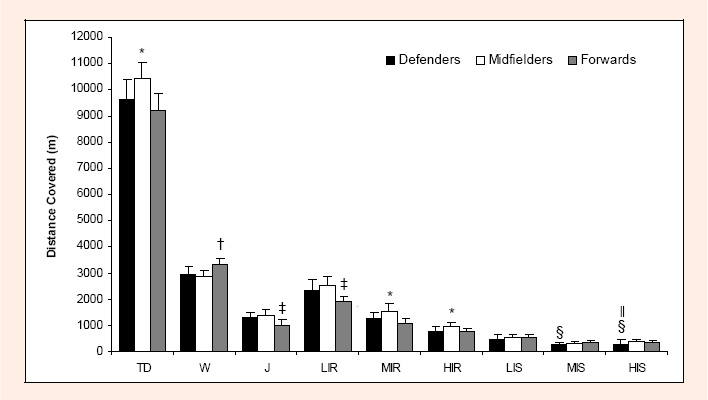
Figure 3. Movement patterns of players according to playing positions (means ± SD). TD: total distance, W: walking, J: jogging, LIR: low intensity running, MIR: moderate intensity running, HIR: high intensity running, LIS: low intensity sprint, MIS: moderate intensity sprint and HIS: high intensity sprint, * significantly higher than defenders (p< 0.05, d= 1.24, 1.18 and 1.03 for TD, MIR and HIR, respectively) and forwards (p< 0.05, d= 2.03, 2.05 and 1.16 for TD, MIR and HIR, respectively), † significantly higher than defenders (p< 0.05, d= 1.30 for W) and midfielders (p< 0.05, d= 2.05 for W), ‡ significantly lower than defenders (p<0.05, d= 1.53 and 1.25 for J and LIR, respectively) and midfielders (p< 0.05, d= 1.52 and 2.17 for J and LIR, respectively), § significantly lower than forwards (p< 0.05, d= 1.02 and 0.44 for MIS and HIS, respectively), || significantly lower than midfielders (p<0.05, d= 0.68 for HIS).