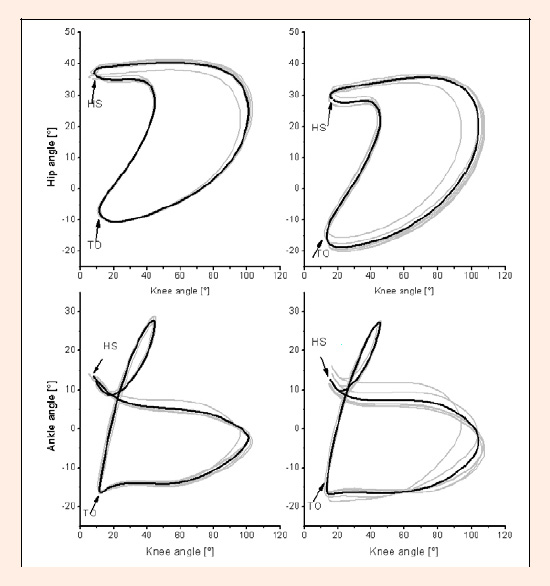
Figure 3. Examples of sagittal hip-knee (upper two) and knee-ankle (lower two) angle-angle-plots for a single representative subject. Shown are the average curves of the six data blocks (grey lines) and the total average (black line). The left two plots display the NT running and the right side depicts RT running. The difference between the two running conditions is noticeable during swing in the knee-ankle plot. Representative data reflect the overall trend for all runners. (HS = heel strike; TO = toe-off).