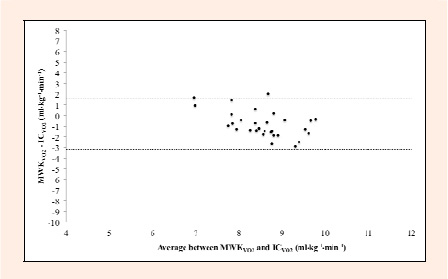
Figure 3. Bland and Altman plot during walk at speed of 3 km·h showing differences in oxygen consumption (VO) between values predicted from MyWellness Key (MWK) and actual oxygen uptake by indirect calorimetry (IC) versus the average of predicted and actual values of VO. The solid line represents the bias (mean of the difference) and the dashed lines are at ±95% limits of agreement.