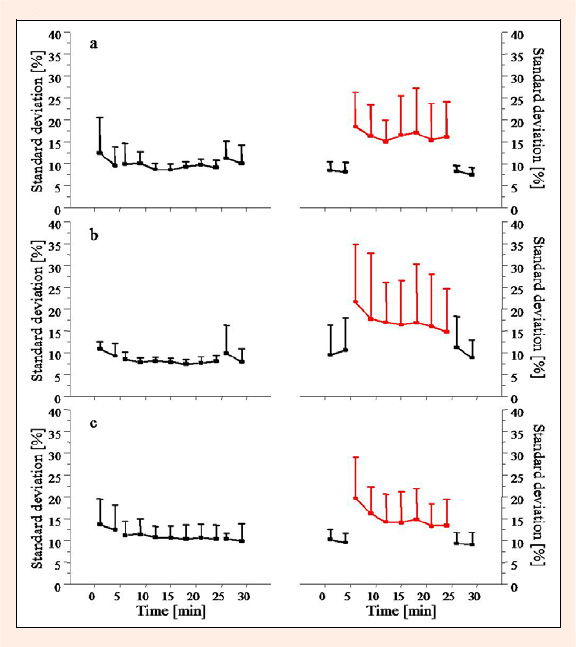
Figure 3. Shown are the average values for variability (i.e. standard deviation) of the RF (a), TA (b), LG (c). Error bars represent confidence intervals. The left diagrams represent the interval when running without tubes, the right diagrams the tube running interval with the actual tube running blocks being represented in red. In both diagrams, the first two blocks represent the two data acquisition blocks of the 5min, the middle 7 blocks the data acquisition blocks of the 20min intervals and the last two blocks the final 5min of running without tubes.