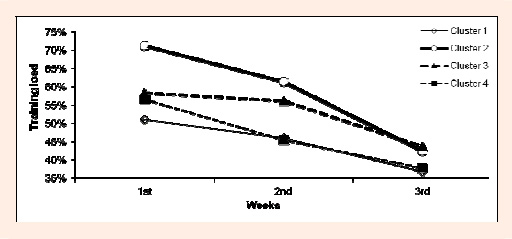
Figure 3. Change in total training load in the four clusters during the taper training period. Cluster 1 (continuous line with white diamonds shaped, 3 periods) shows a low training load peak during the 1 week of TP associated with a slow decay logarithmic pattern. Cluster 2 (continuous line with white circles, 33 periods) was characterized by a high training load peak during the 1 week associated with a fast decay logarithmic pattern. Cluster 3 (broken line with black triangles, 34 periods) showed a medium training load peak during the 1 week associated with a low decay logarithmic pattern. Cluster 4 (broken line with black squares, 15 periods) is associated with a medium training load peak during the 1 week associated with a slow decay exponential design. ∆P for designs 2 (HP, FD) and 3 (MP, LD) was significantly lower than ∆P for design 4 (MP, SD).