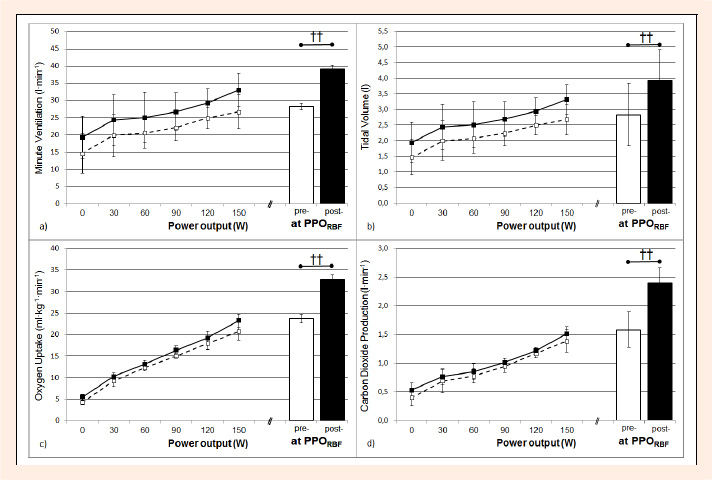
Figure 3. Minute ventilation (a), tidal volume (b), oxygen uptake (c) and carbon dioxide production (d) during the incremental test with RBF pre- (white squares and columns) and post-training (black squares and columns) in Group E only. Values are means (±SD). PPO, peak power output at incremental exercise test with reduced breathing frequency. Significant training effect (paired T test): † † p < 0.01.