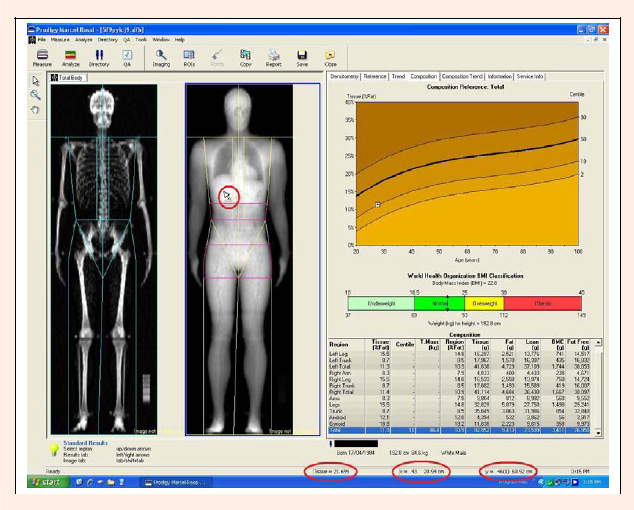
Figure 3. Screenshot of the enCORE® software showing the two BMD and TISSUE images derived from the respective matrices. When the mouse is placed on a given area (red circle), the mass and the coordinates the local mass element pointed to by the arrow, are shown on the bottom of the screen (red ellipses).