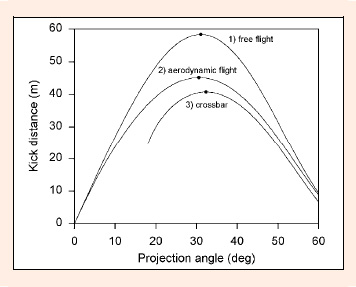
Figure 3. This plot shows the effects on the kick distance and optimum projection angle of: i) the relationship between projection velocity and projection angle, (θ¸); ii) aerodynamic forces; and iii) the height of the crossbar. Curve 1 is for a ball in free flight, (θ¸), and landing on the ground. Curve 2 is for a ball in aerodynamic flight, (θ¸), and landing on the ground. Curve 3 is for a ball in aerodynamic flight, (θ¸), and clearing the crossbar. The dots mark the maximum kick distance and optimum projection angle for each of the three curves. In curve 3 the ball does not pass over the crossbar when the projection angle is less than 18°