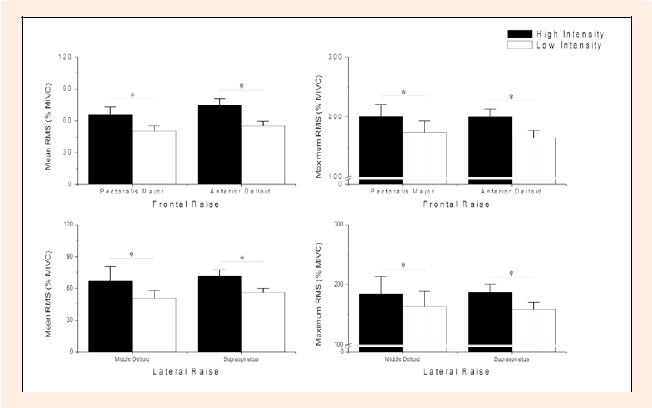
Figure 3.
Comparisons between intensities for muscle activation.
The columns represent the mean and the error bars represent the standard error of the mean. * Indicates significant differences (p<0.05) between intensities.