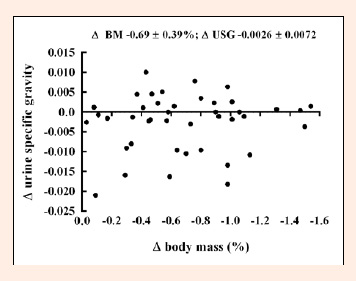
Figure 3.
Individual and mean ± SD values of change in body mass and change in urine specific gravity pre- to post-training for all three sessions (n = 42).