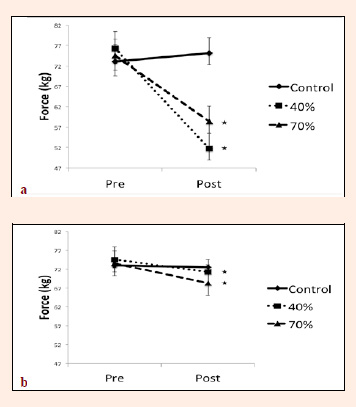
Figure 3. MVC force pre-post intervention. Representation of force in the dominant, fatigued leg (a) and non-dominant, non-exercised leg (b), pre- and post-intervention. Variation in data indicated by standard error. Significance was set at p < 0.05. * indicates significant pre-post intervention differences. Whereas there were significant differences between all 3 conditions with the dominant fatigued leg post-intervention, there were no significant differences between the 40% and 70% conditions for the contralateral non-exercised limb post-intervention.
